Calem Blogs
Blogs of CalemEAM
How to Visualize Item Consumption Monthly
Monthly consumption for an individual item can be visualized in release R2022a of March 2022. It is based on the inventory KPI charts.
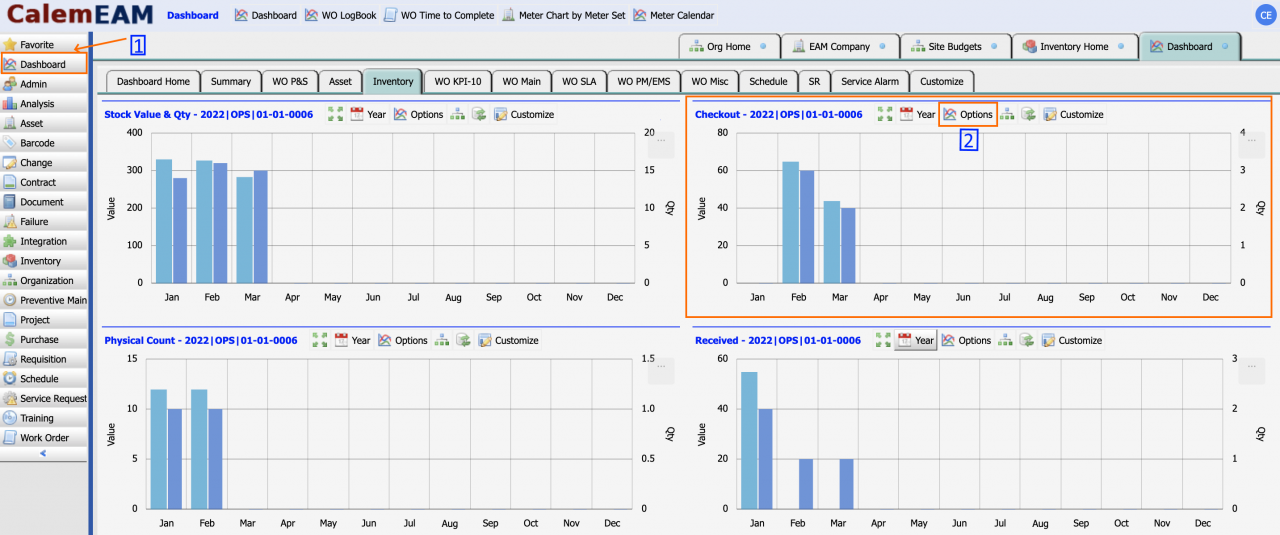
- Menu: Dashboard | Inventory Tab | Checkout Bar Chart
- Click Dashboard (1) to view Dashboard module
- Click "Inventory" Tab for inventory KPIs
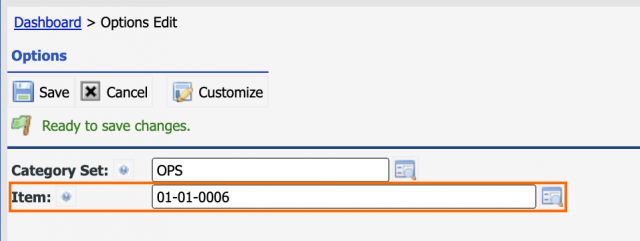
- Click "Options" (2) in the chart above to set an individual item to show in the charts. In the options screen:
- Enter an item to visualize monthly consumption
- Optionally, enter a storeroom category set to exclude storerooms from the KPI calculation. See the Budget Blog for a discussion of storeroom category sets.
- Click "Save" to commit the changes and refresh inventory KPIs.
- The caption of the chart is "2022|OPS|01-01-0006" indicating the KPI is calculated for year "2022", storeroom category set "OPS", and item "01-01-0006".
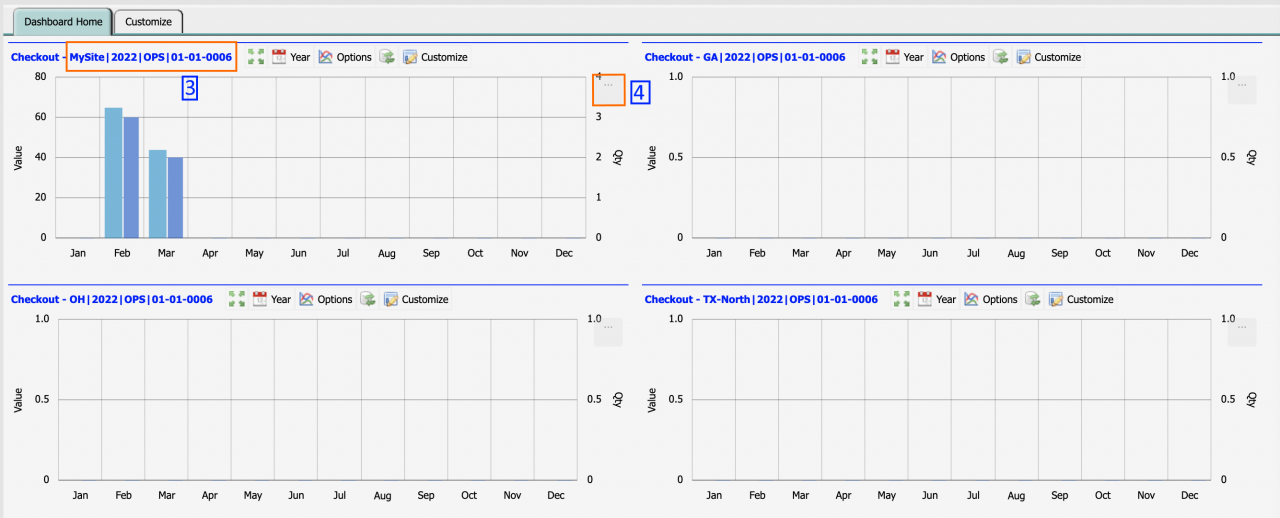
- Click Multi-Site menu icon annotated above to visualize monthly consumption of the item in sites side by side if there are more than one site in your Calem service.
- The caption of a site chart (3) is "MySite|2022|OPS|01-01-0006" which shows the site "MySite", year "2022", category set "OPS" and item "01-01-0006".
- The chart menu "..." (4) can be used to print or export the chart.
Resources
- How to Manage Maintenance Budgets in Calem
- Multi-Site KPIs for Inventory
- How to Transfer and Dispose Inventory
- How to Track Asset Off-Site Repairs
- How to Use Price Lot in Calem
- Work Order Life-Cycle Diagrams
- Asset Tracking in Calem
- User Guide and Admin Guide (customer account required)
- Calem Enterprise Training Site
- Calem Enterprise Blogs
- Calem Enterprise demo
Related Posts
By accepting you will be accessing a service provided by a third-party external to https://www.calemeam.com/


