New purchase performance KPIs are available in the coming release R2026 (February 2026). They surface top vendors by spend so that outliers can be easily spotted. The metrics are calculated for all vendors so one can export the metrics for further analysis.
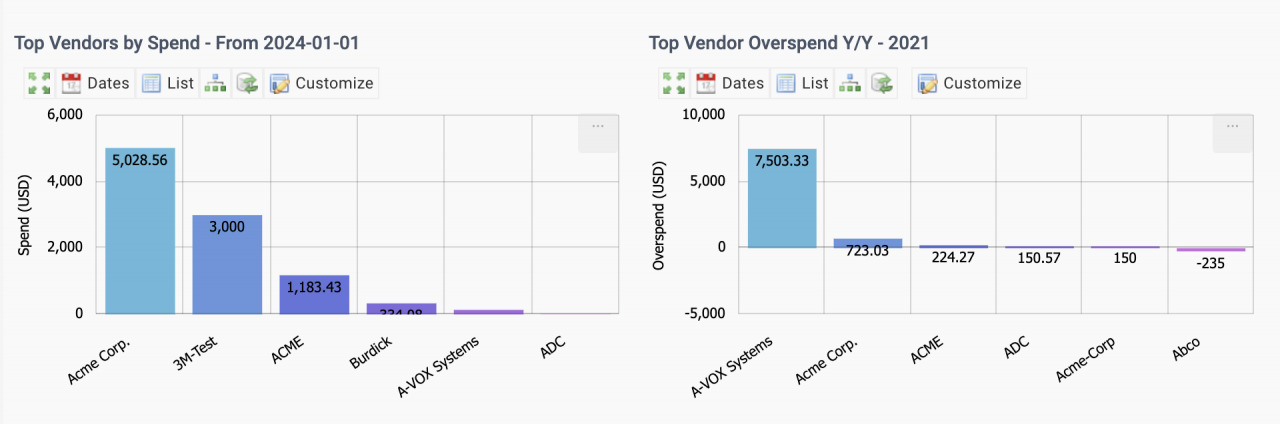
1. Top Vendors by Spend
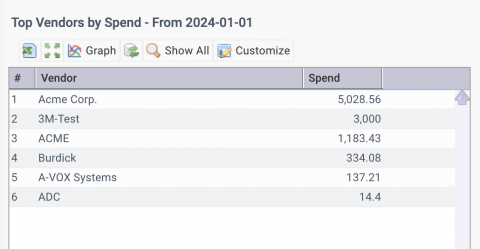
Top vendors by spend are calculated from purchase orders (PO). A reporting period can be defined by "Dates" menu (in screenshot above).
- Top 10 vendors are shown in the KPI bar chart.
- They can also be presented as list view ("List" menu above) for export.
- "Show All" menu in the List view shows all vendors with total spend in the reporting period.
- You may export the data to excel for further analysis.
- Click a vendor row in the list to drill down to POs.
- Multi-Site drill-down is available - see this blog for an introduction of multi-site drill-down.
2. Top Vendor Overspend Y/Y
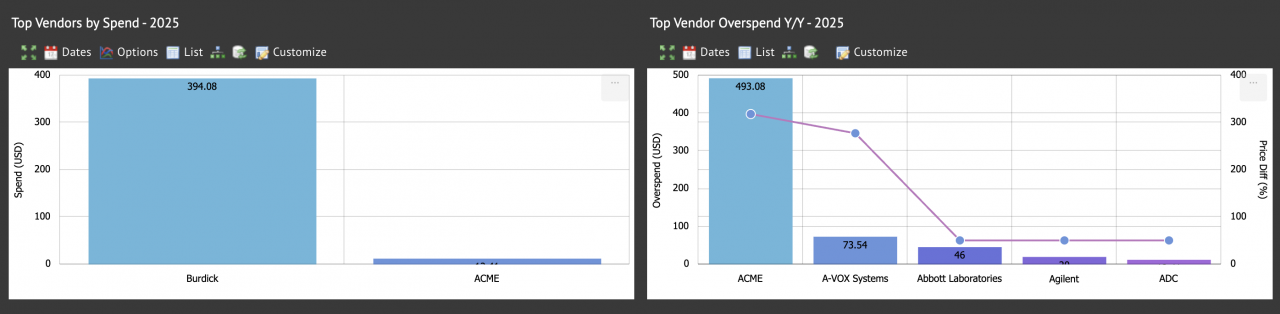
This KPI shows the increase of total spend per vendor of current year versus last year.
- Top 10 vendors are shown with the highest overspend.
- Average price changes (%) by vendors are shown in the KPI.
- Shared items purchased from a vendor in both years are included in the calculation.
- A fixed-basket version is used by default. The average prices of items of a current year are weighted by the quantities purchased last year so that price changes by vendor are captured.
- Alternatively, the average prices of shared items of current year are compared to the average prices of last year.
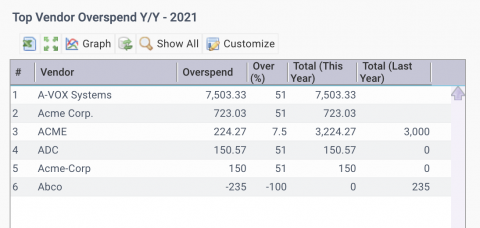
- List view shows total expenditure of current and previous year per item.
- Positive overspend are increases from last year, and negative reductions.
- Click an vendor row to drill down to POs.
- A percentage of 51 is used for a vendor without spend last year.
- Show All menu will list all vendors with overspend information. Exporting the data to excel for further analysis.
- Multi-Site drill-down is available - see this blog for an introduction of multi-site drill-down.
2.1 Fixed Basket Price Comparison
The idea: take the items you bought from a vendor in both years, keep last year's quantities fixed, and price that same set of items at each year's prices. Only the prices change between the two years, so a shift in what you bought doesn't distort the comparison. Economists call this a Laspeyres price index (https://corporatefinanceinstitute.com/resources/economics/laspeyres-price-index).
Example: vendor Acme
| Item | Prev year | Curr year |
| A (gasket) | 100 @ $10 = $1,000 | 20 @ $11 = $220 |
| B (pump seal) | 10 @ $50 = $500 | 80 @ $52 = $4,160 |
| C (filter) | not bought | 5 @ $20 = $100 |
Item C doesn't count as comparable because Acme only sold it in one of the two years. So the basket is items A and B, weighted by last year's quantities: 100 of A and 10 of B.
- Prev unit cost = ($1,000 + $500) / 110 = $13.64
- Curr unit cost = ($11 × 100 + $52 × 10) / 110 = $1,620 / 110 = $14.73
- Change: +8.0%. That's the real price increase: A went up 10% and B went up 4%, weighted by how much you bought of each.
Fixed-basket is the option out of the box for the price change KPI above. Another option is to average prices over its own quantities of each year. The price change metric is not as good.
- Prev = $1,500 / 110 = $13.64
- Curr = ($220 + $4,160) / 100 = $43.80 → +221%
That 221% jump is almost entirely mix: this year you mostly bought the expensive item B instead of the cheap item A. The basket mode removes that effect, so the change only reflects price movement.
Additional Resources
- Purchase KPI A: Item Price and Overspend
- Multi-Site KPIs for Inventory
- Multi-Site KPIs for Maintenance
- Bulk Update by Export and Upload
- Instance Dashboard and Home Pages
- Part Repair Processes in Calem
- How to Track Asset Off-Site Repairs
- How to Use Price Lot in Calem
- Work Order Life-Cycle Diagrams
- Asset Tracking in Calem
- User Guide and Admin Guide (customer account required)
- Calem Enterprise Training Site
- Calem Enterprise Blogs
- Calem Enterprise demo