Calem Blogs
How to Use KPIs for Process Improvement
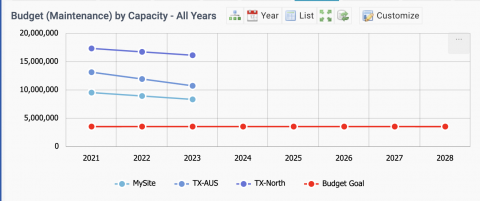
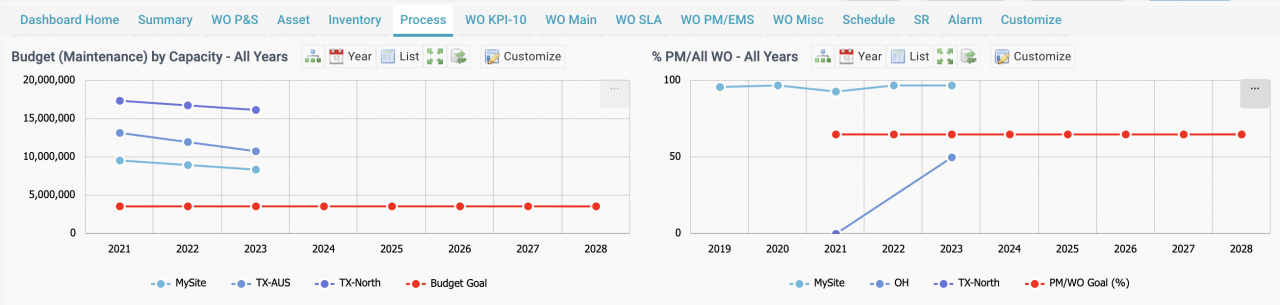
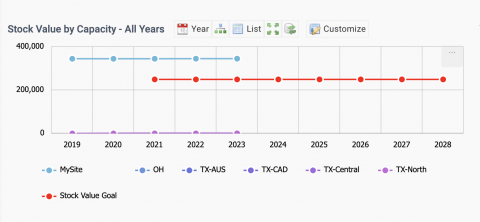
Process KPIs are available in the coming release of R2023e scheduled for November 2023. They show the goals and operational results across sites. They are great tools for process improvement. For instance, the diagram below shows the goals of maintenance budgets (in red) and the operational budgets of three plants.
1. Capacity Factors
Capacity factors are used to normalize goals and operational results.
- They allow management to compare results of sites large and small by common metrics.
- For instance, there are two plants in an organization. The production volume of plant A is twice of plant B. The capacity factor is 2 for plant A, and 1 for plant B.
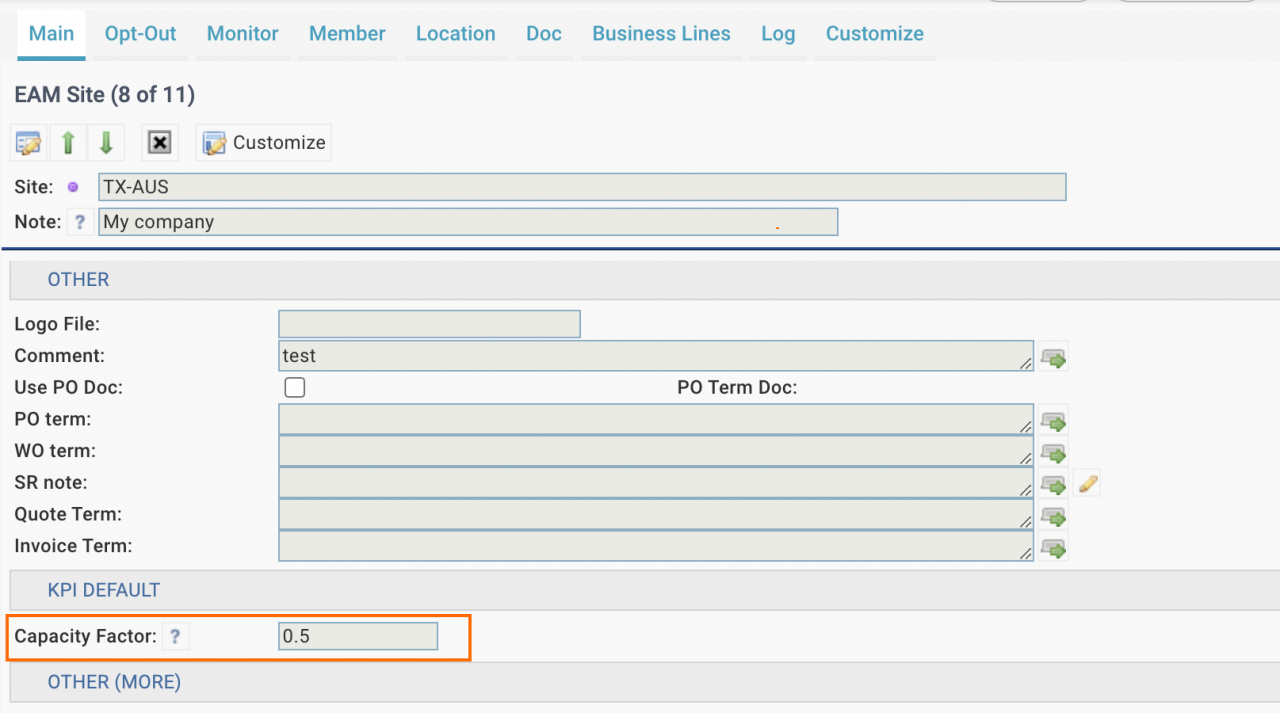
- Menu: Organization | EAM Company | Site tab.
- Edit a site and set its capacity factor.
- This capacity factor will be used unless a year specific factor is defined below.
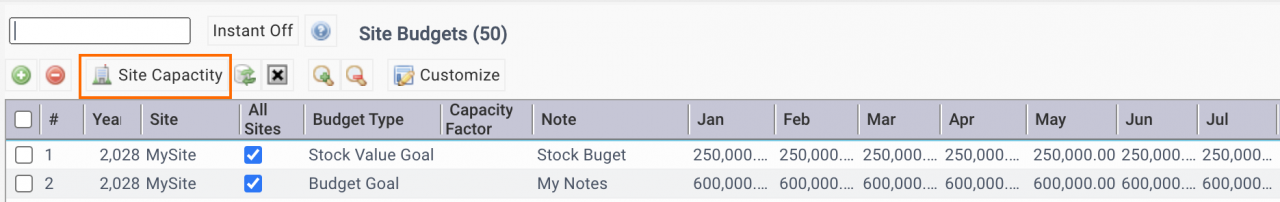
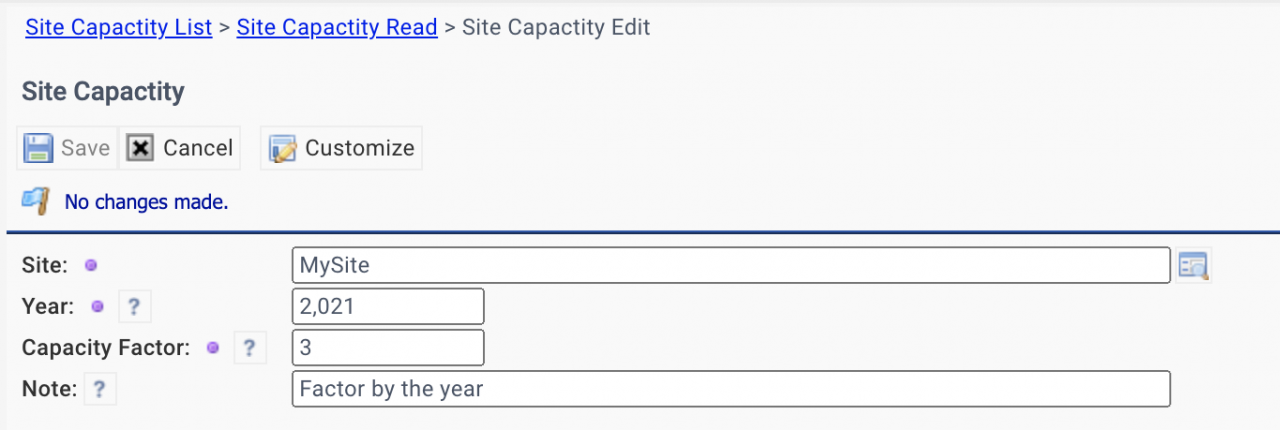
- The capacity factor for a site may change year by year. Go to Site budget to set factors by the year.
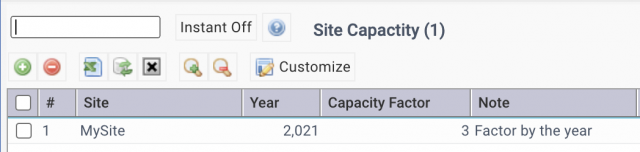
- Menu: Organization | Open | Site Budget | Site Capacity
- Capacity Factor by Site/Year
- You may use the "Export" menu to export and update site capacity.
2. Process Goals
Process Goals are defined so that sites large and small can be compared by the same metric. They are configured as budgets.
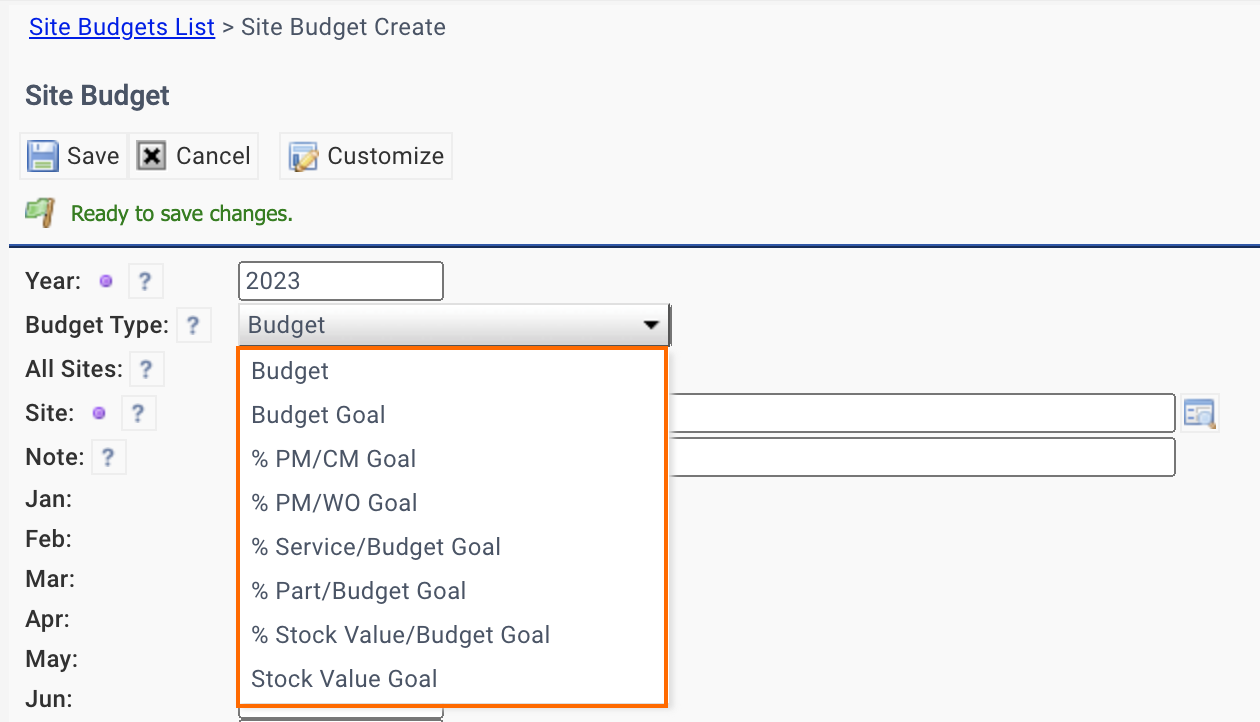
- Menu: Organization | Open | Site Budgets
- The goals are defined for all sites.
- Set "All sites" to 1 for goals of your organization.
- Select a type of goals to set.
- The "Site" for goals are for access control.
- The goals need to be normalized when applicable.
- Budget Goal and Stock Value Goal need to be normalized.
- Upload goals and budgets in excel files
- Use Organization | Report | Site Budgets to export budgets and goals.
- Update or add new budgets/goals for upload.
3. Process KPIs
The following process KPIs are provided.
| 1) Budget Goals - capacity normalized. Both budgets and budget goals are normalized by capacity factors. They are shown as lines in the KPI. The budgets are by sites while the budget goals are for all sites. Budgets and budget goals are defined in the site budgets (Organization | Open | Site Budget). |
| 2) % PM/CM Goal - the % of PMs (preventive work orders) over CMs (corrective work orders) |
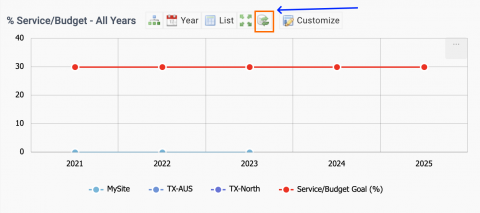
| 3) % Service/Budget Goal - the % of outside services spent over the total maintenance budget |
| 4) % Part/Budget Goal - the % of spare parts spent over the total maintenance budget |
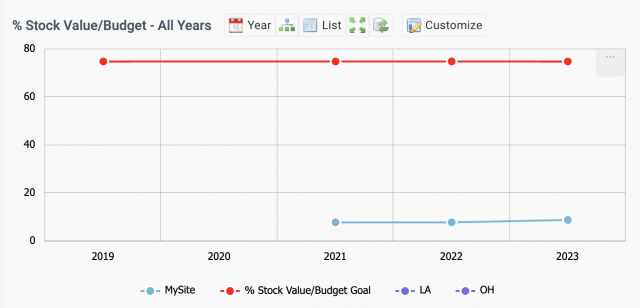
| 5) % Stock Value/Budget Goal - The % of stock value over the total maintenance budget |
| 6) Stock Value Goal - the goal of stock value to keep. It is capacity normalized. |
| 7) % PM/WO Goal - the % of PMs out of all work orders |
| 8) Actual/Budget - the actual spent (parts and services) normalized vs budget goals |
4. Multi-Site KPIs
Process KPIs show multiple sites in one chart. There are options in tuning the KPIs.
- A maximum of up to 6 sites can be shown in a KPI chart.
- Use the menu of "Multi-Site KPI" to select up to 6 sites to show in a KPI.
- Up to 6 sites will be selected by Calem if not defined.
- Use "Year" menu to select a year to zoom in.
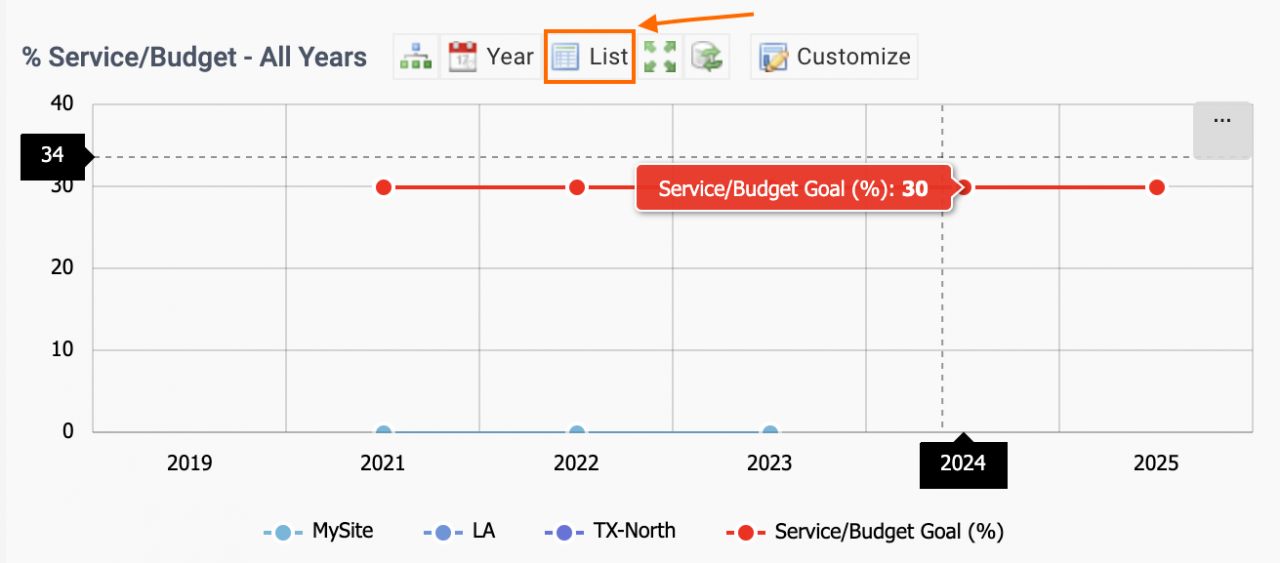
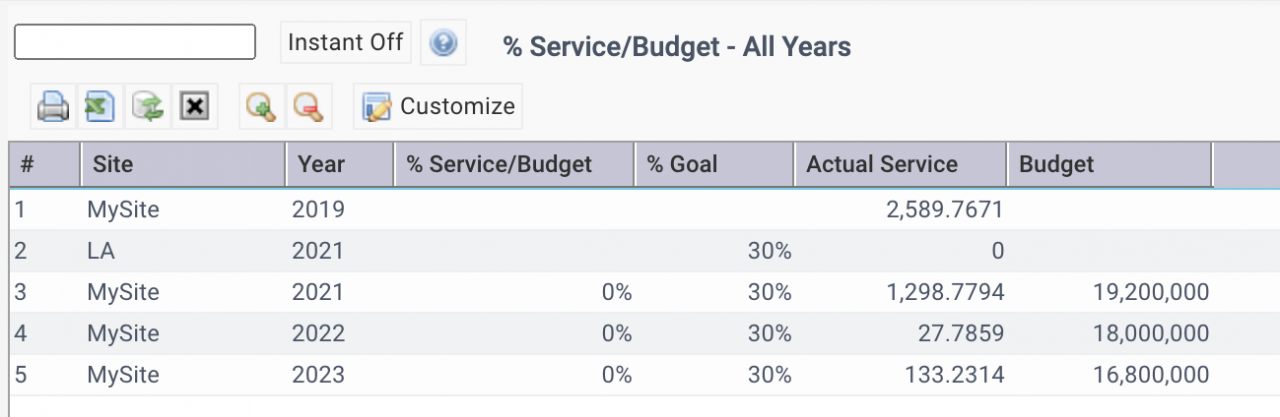
- Use "List" menu to view the data of the KPIs.
- Drill-down of list rows are available for selective KPIs for a year.
- For instance, "% PM/WO" can be drilled down when zooming into a year.
5. Refresh KPIs Manually
The KPIs are refreshed by a time latency (for instance, every 5 hours) so that the process KPIs open instantly if you are open/close the KPI forms. You can manually refresh a KPI chart by the "Refresh" menu.
- See this blog for more information.
6. KPI Drilldown by Year
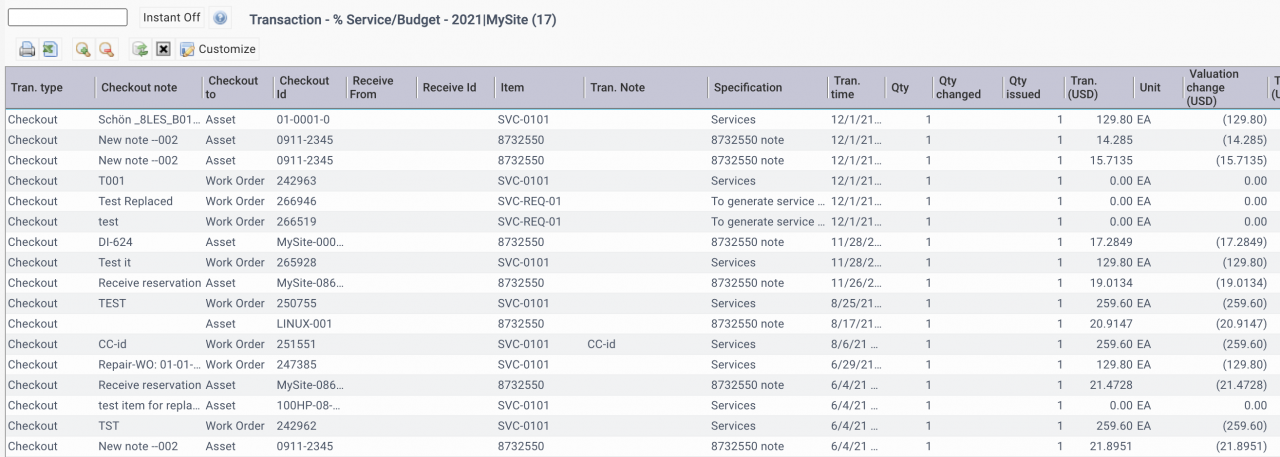
Some KPIs support drilldown at year level. For instance, the service/budget and part/budget KPIs allow drilldown at year level. The service/budget KPI will be used as an example.
- Click "List" menu to switch to list view.
- Click a row to drill down to services checked out for a year.
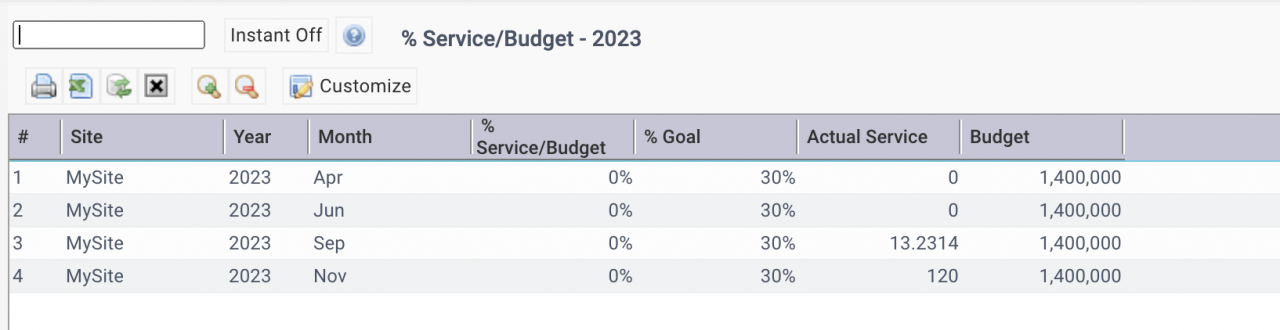
7. KPI Drilldown by Month
A KPI may support drilldown at month level. For instance, the service/budget and part/budget KPIs allow drilldown at month level. The service/budget KPI will be used as an example.
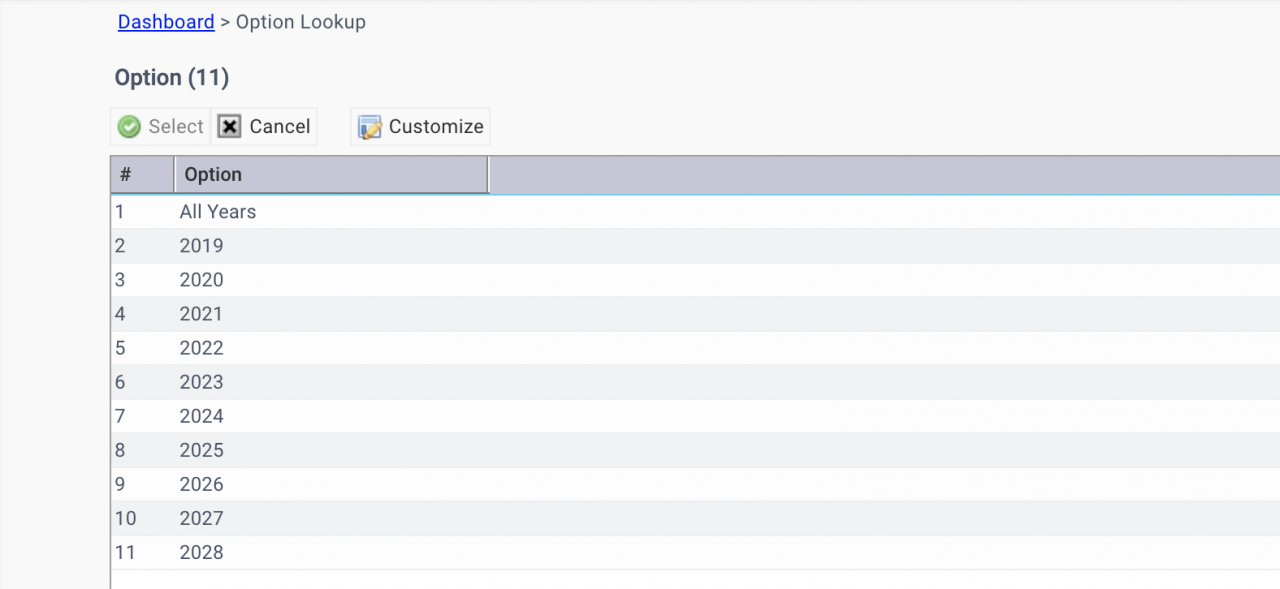
- Click "Year" menu to view the list of years to select.
- You may select a single year to view, or "All Years" to stay at year level.
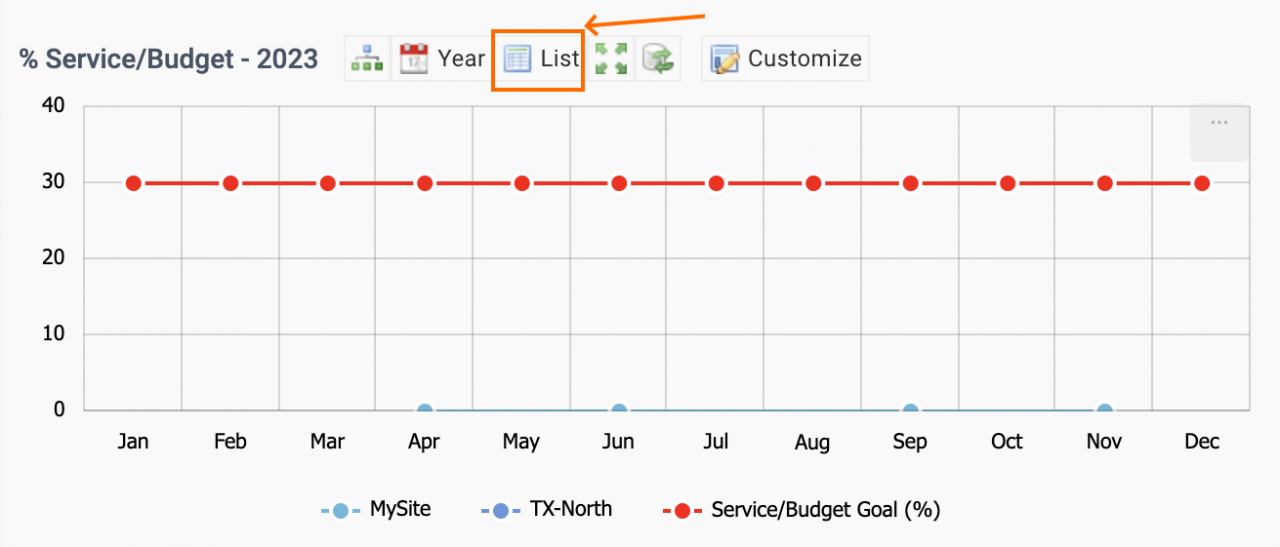
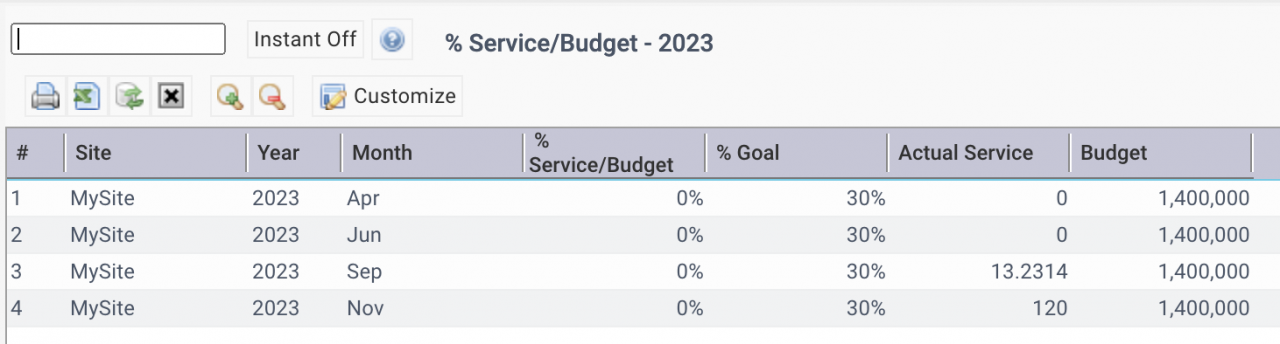
- In a single year view, click "List" menu to switch to a list view with data for months of the year.
- Click a row of the list to drill down to services checked out for a month of the year.

Resources
- Multi-Site KPIs for Inventory
- Multi-Site KPIs for Maintenance
- Bulk Update by Export and Upload
- Instance Dashboard and Home Pages
- Part Repair Processes in Calem
- How to Track Asset Off-Site Repairs
- How to Use Price Lot in Calem
- Work Order Life-Cycle Diagrams
- Asset Tracking in Calem
- User Guide and Admin Guide (customer account required)
- Calem Enterprise Training Site
- Calem Enterprise Blogs
- Calem Enterprise demo
About the author

Related Posts
By accepting you will be accessing a service provided by a third-party external to https://www.calemeam.com/