Calem Blogs
Blogs of CalemEAM
Meter Reading Chart
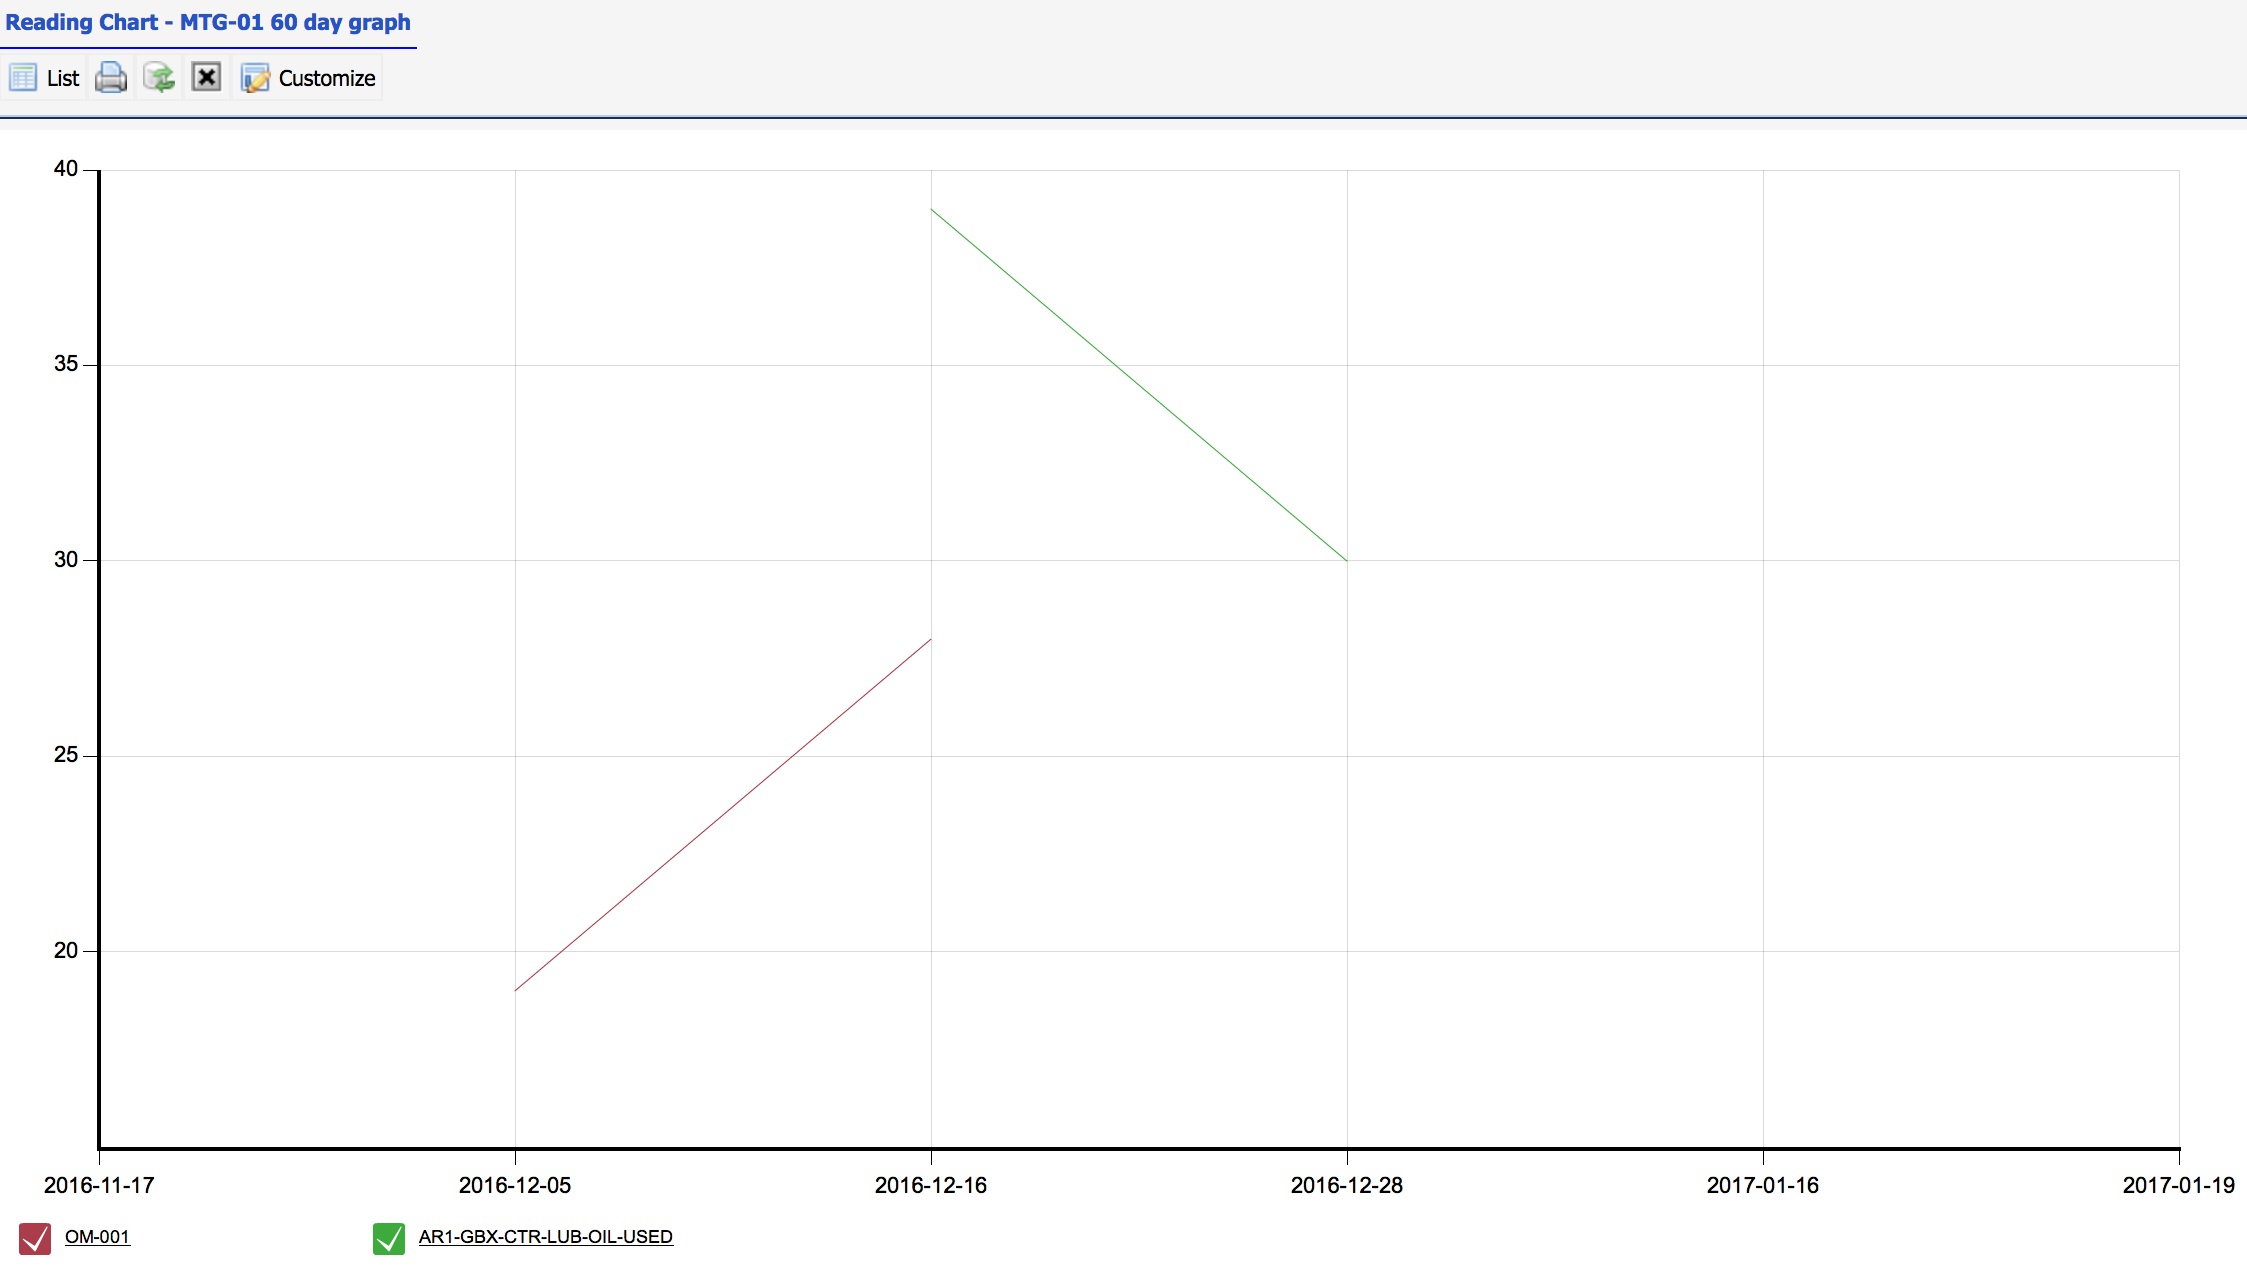
Meter reading chart is available in R10j. It can be used to better understand asset performances. The meter graph provides the following features:
- Menu path: Dashboard module | Meter Chart
- A graph can have up to 5 meters in a graph
- A graph can have a time period to draw readings
- A graph configuration can be stored in the graph list so one can open a metering graph quickly
- Reading list can be exported to excel file for processing in excel
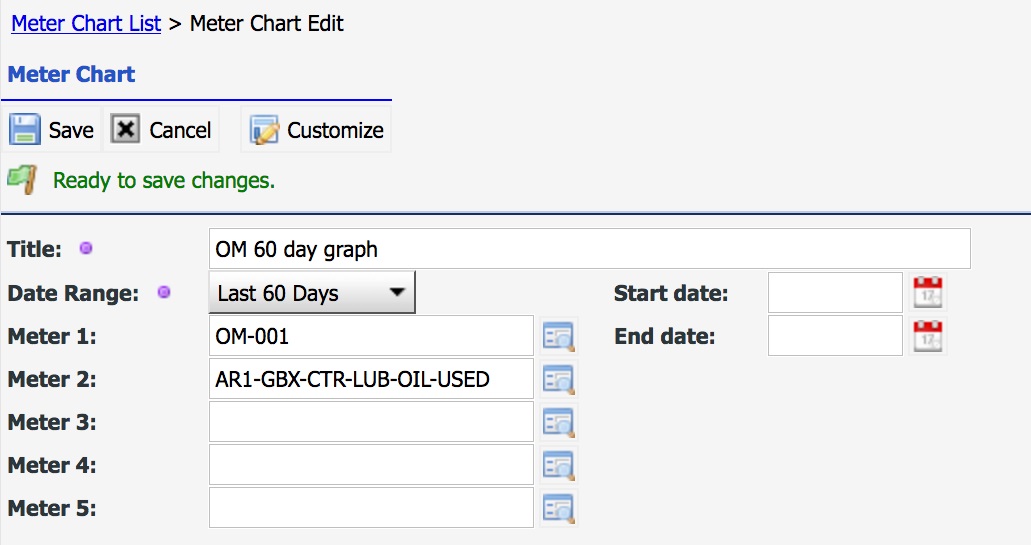
You may place up to 5 meters in a meter chart:
About the author

By accepting you will be accessing a service provided by a third-party external to https://www.calemeam.com/