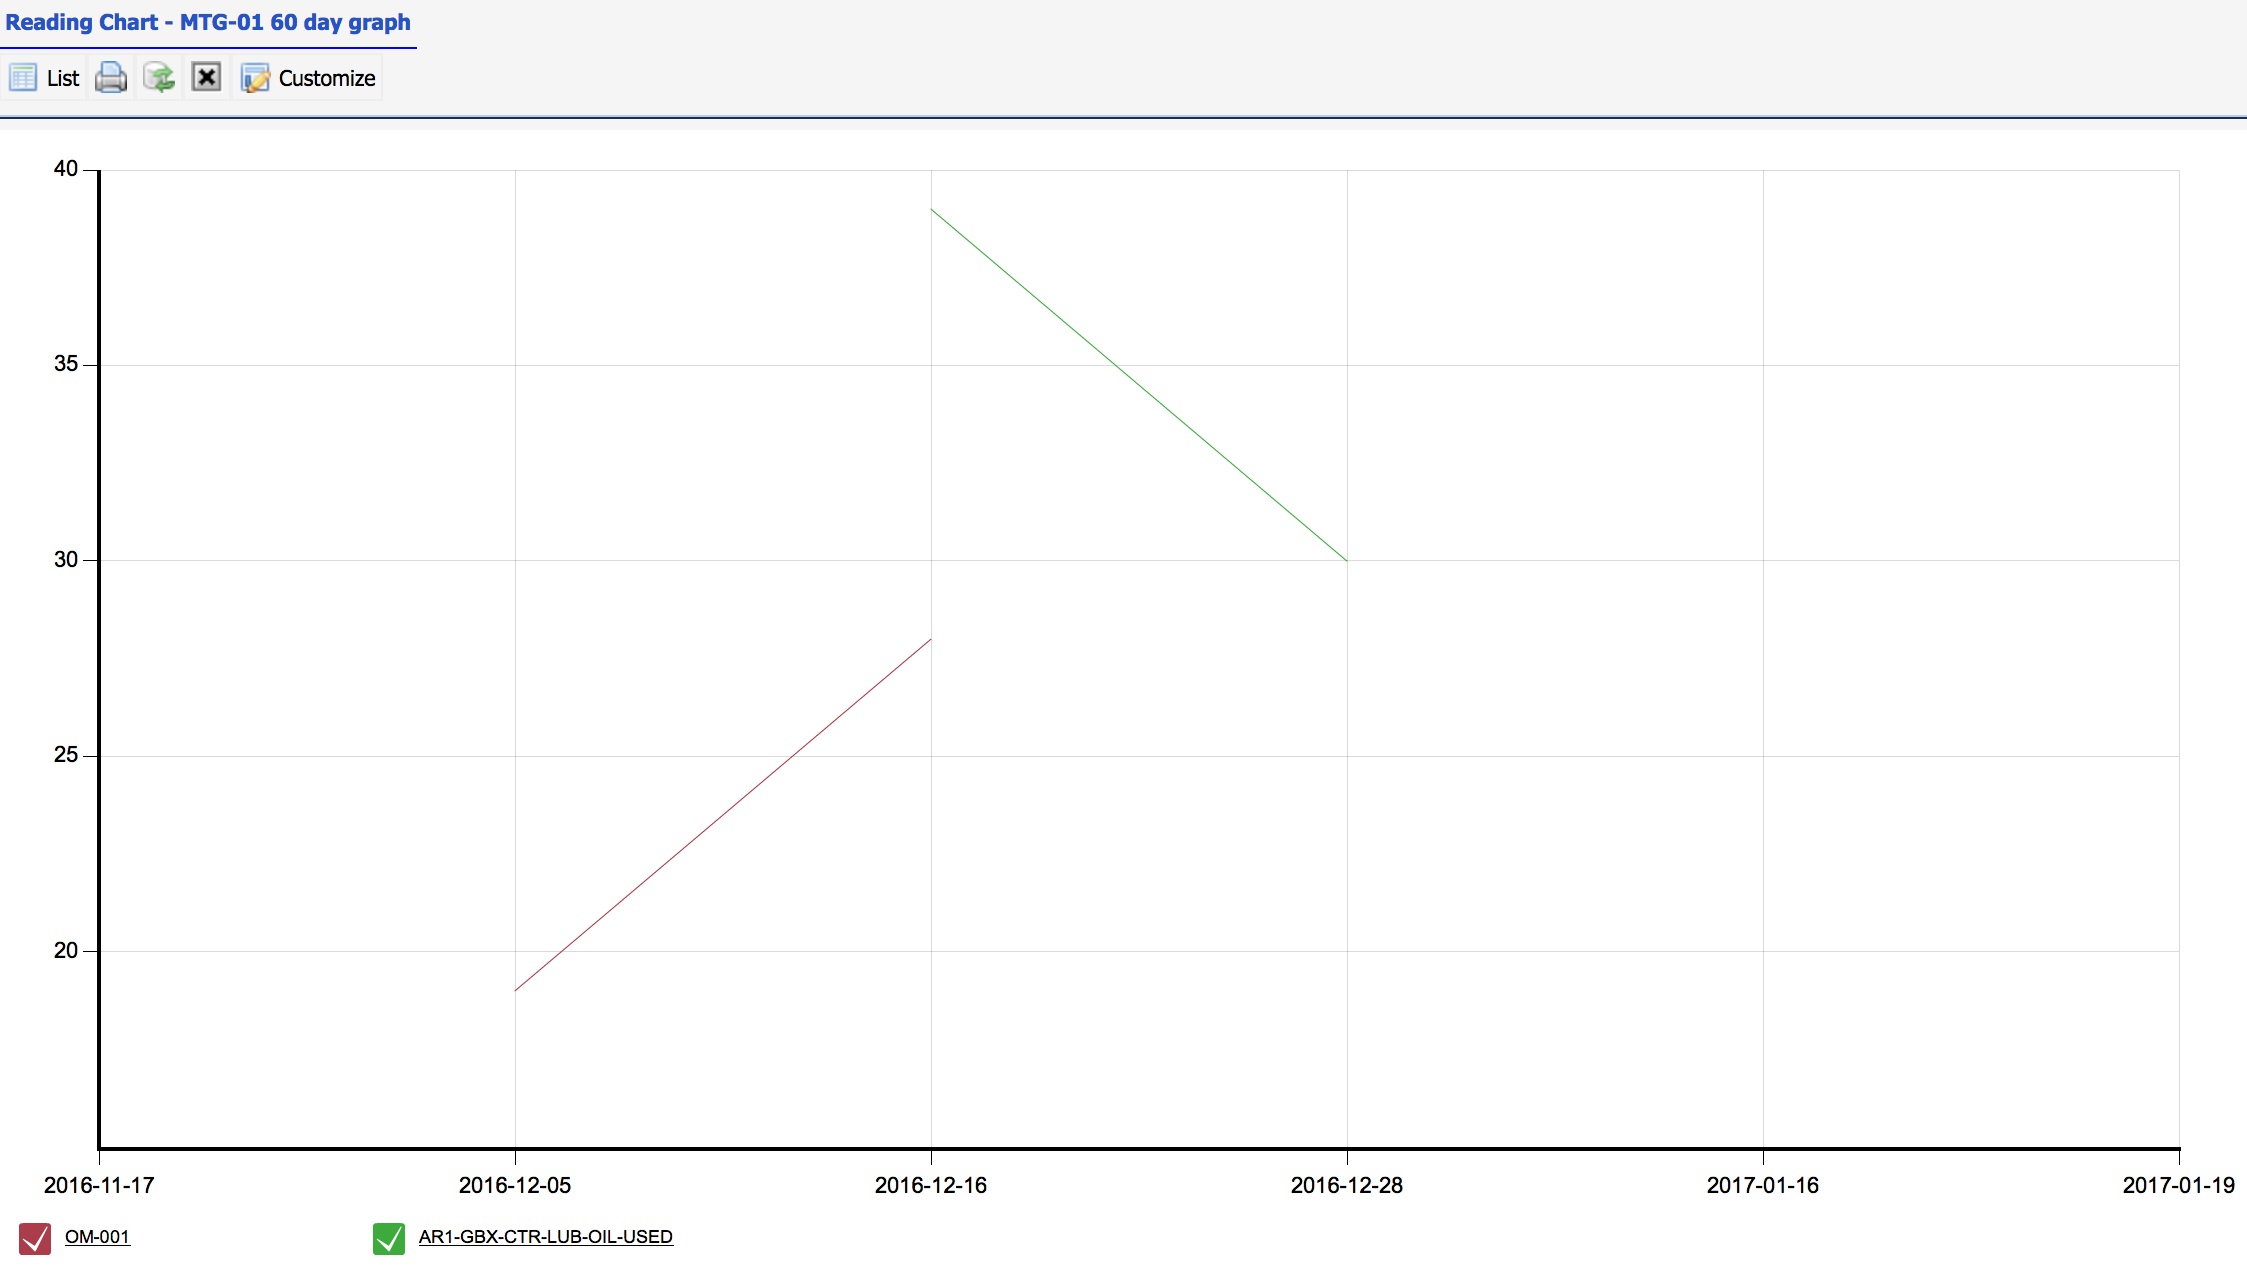
Meter reading chart is available in R10j. It can be used to better understand asset performances. The meter graph provides the following features:
- Menu path: Dashboard module | Meter Chart
- A graph can have up to 5 meters in a graph
- A graph can have a time period to draw readings
- A graph configuration can be stored in the graph list so one can open a metering graph quickly
- Reading list can be exported to excel file for processing in excel
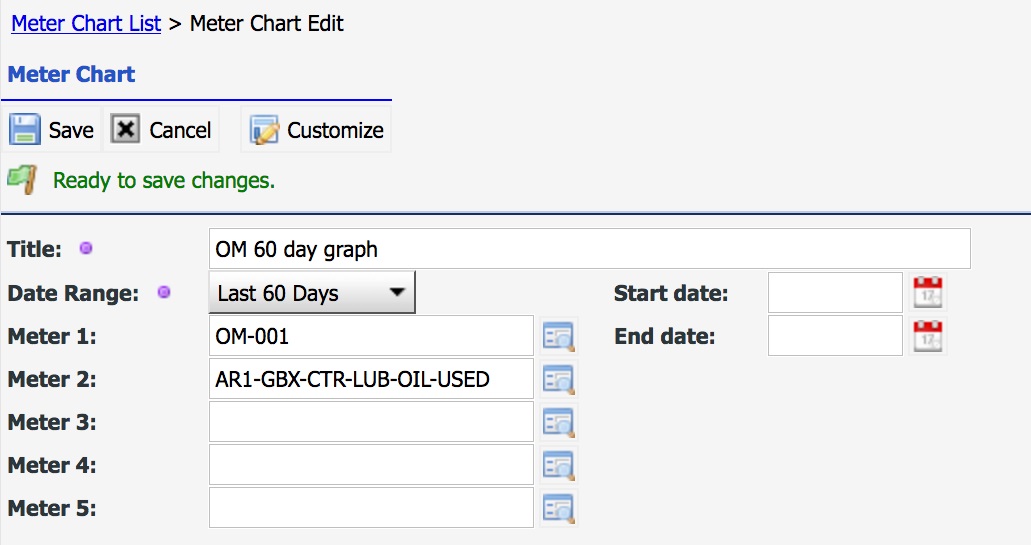
You may place up to 5 meters in a meter chart: